Pressure drop reduction in corrugated pipe, and flow behavior of solid nitrogen particles
With respect to corrugated pipe, studies have been conducted by numerous
researchers on pressure drop. However, most of these involve water or air
at room temperature. The lengths of corrugated pipe in actual use are also
typically short, and based on experience, designs have tended to assume
that pressure drop will correspond to that in smooth-walled pipe having
3-4 times the length.
Corrugated pipes serving to absorb pipe contraction at cryogenic temperatures
are essential elements of piping arrangements for cryogenic equipment.
Increased pressure drop in piping necessitates greater required power for
transport pumps, and is a cause of decreased system performance. In the
case of stainless steel, for example, cooling from room temperature to
cryogenic levels (77 K, 20 K, or 4 K) results in pipe contraction of approximately
3 mm per 1 m in pipe length. Accordingly, substantial stresses are placed
on piping and equipment, which can easily lead to damage. In the case of
the long-distance transport piping system, the total length of corrugated
pipe would be substantial with pressure drop properties taking on major
importance.
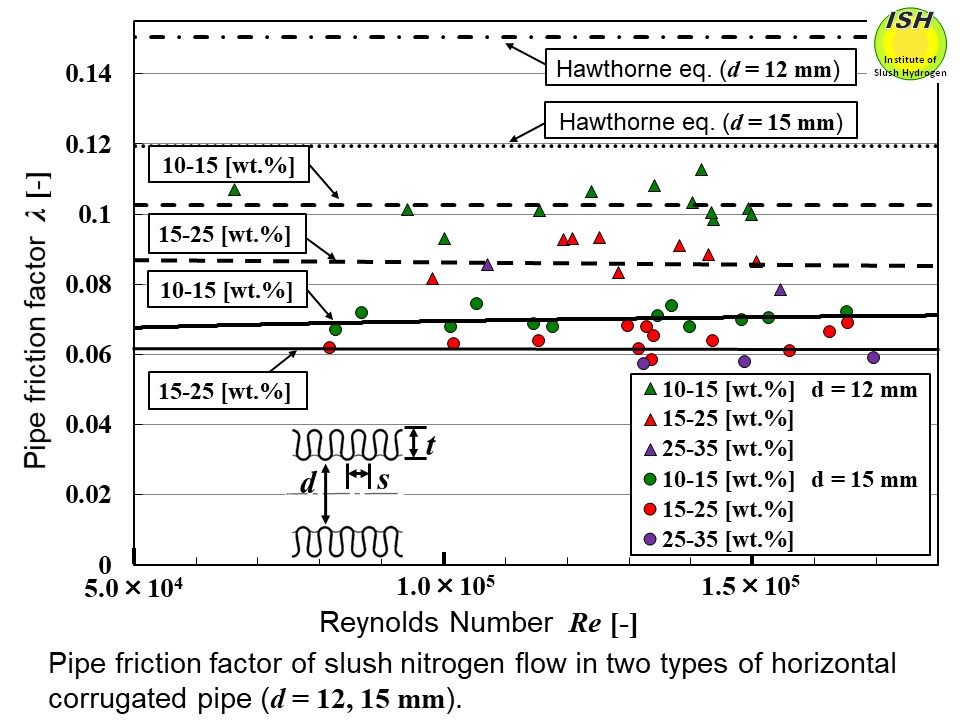
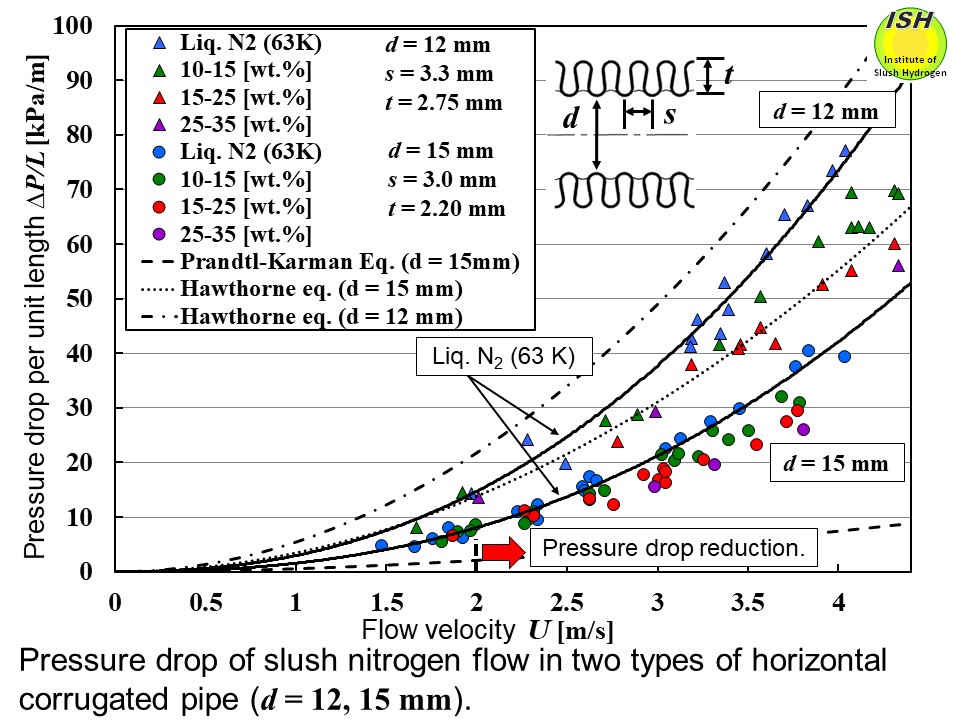
Measurement results for flow velocity and pressure drop per unit length
in two types of horizontal annular (not spiral) type corrugated pipe with
inner diameters d = 12 mm (Type A) and d = 15 mm (Type B) are illustrated in the above figure [28]. The measured values for liquid nitrogen, the least squares approximation
curves, the Prandtl-Karman eq. and the Hawthorne eq. (A: λ = 0.151, B: λ = 0.120) are shown. Hawthorne et al. [34] have reported a pressure drop
eq. for water and air at room temperature in corrugated pipe.
At the same flow velocity, pressure drop values for liquid nitrogen in
the corrugated pipes A and B are 5-9 and 3-6 times the Prandtl-Karman eq.
values, respectively. All of the values calculated for liquid nitrogen
pressure drop using the Hawthorne eq. were greater than the experimental
values. With respect to slush nitrogen pressure drop in the two corrugated
pipes, the values were about the same or slightly higher in both cases
than for liquid nitrogen in the low flow velocity region of within 2 m/s,
while pressure drop reduction was exhibited in the region above 2 m/s, with the
amount of reduction becoming greater as the solid fraction increased.
The maximum amounts of pressure drop reduction (%) obtained in the experiment,
together with the solid fractions, were 37% at 30 wt.% for Type A and 31%
at 27 wt.% for Type B, as compared to liquid nitrogen.
The experimental results with respect to the pipe friction factor λ and the Re number for slush nitrogen are given in the figure below [28]. In the figure, the least squares approximation curves corresponding
to the experimental values for the solid fraction ranges of 10-15 and 15-25
wt.% are indicated by dashed (Type A) and solid (Type B) lines, respectively.
For reference, the Hawthorne eq. values (A: λ = 0.151, B: 0.120) are also
given. In the cases of both corrugated pipes A and B, the pipe friction
factor for slush nitrogen is nearly a constant value. A clear difference
can be observed with respect to low solid fraction (10-15 wt.%) and high
solid fraction (15-35 wt.%), with the pipe friction factor becoming lower
as the solid fraction increases.
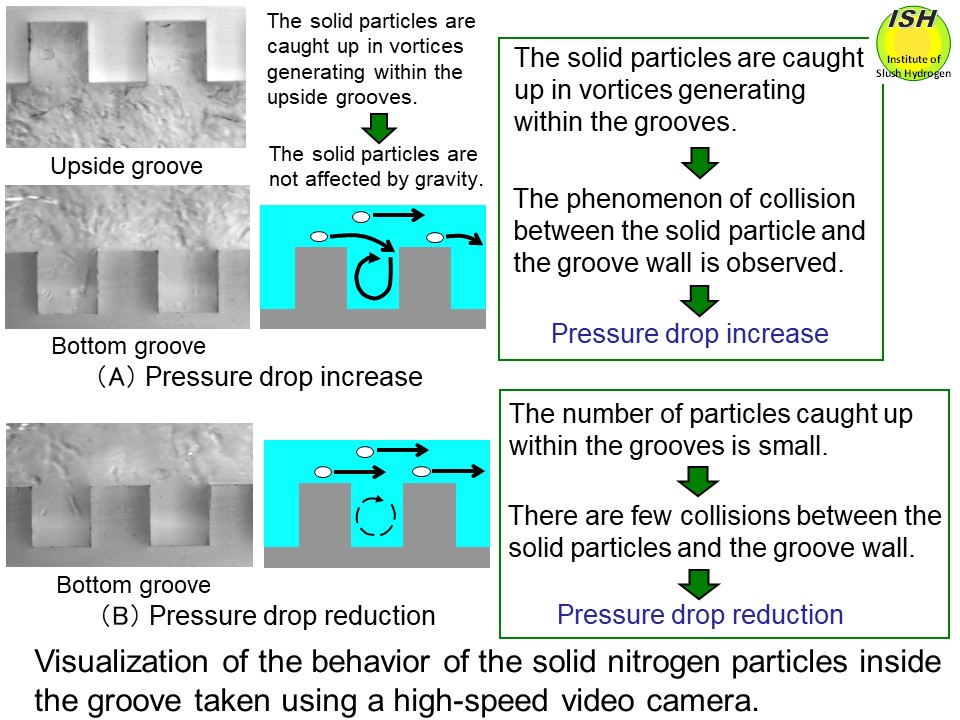
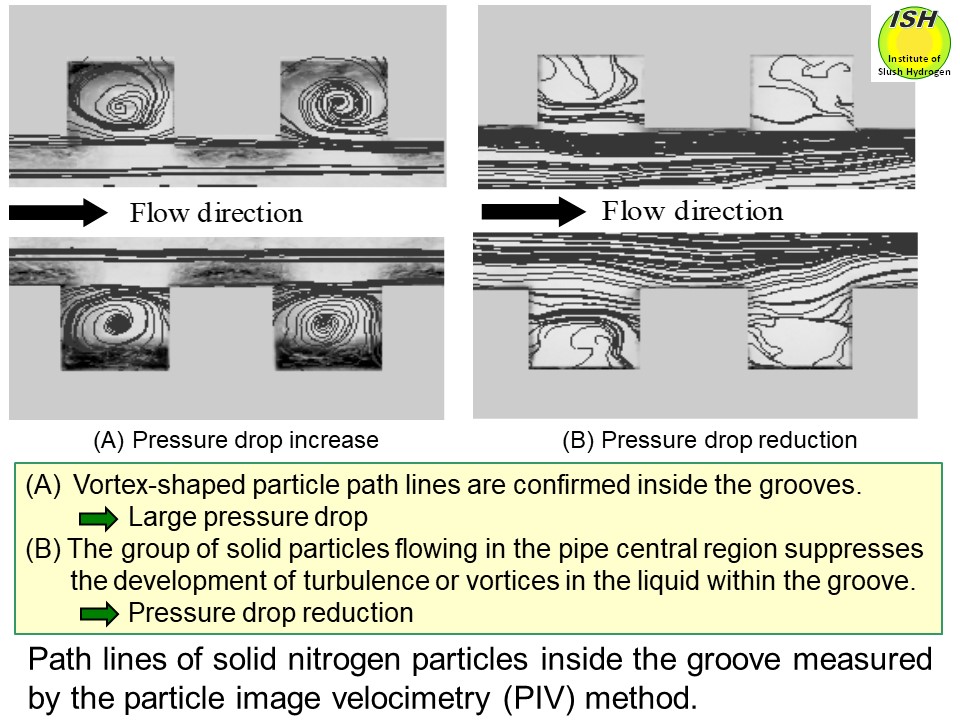
To clarify the mechanism involved in pressure drop reduction, path lines
of solid nitrogen particles inside the transparent grooved rectangular
pipe (16 mm×12 mm, with groove depth of 2 mm) to simulate corrugated pipe
were measured using the PIV method*.
The figures below present the visualization of solid nitrogen particles inside the groove
taken using a high-speed video camera and the PIV measurement results corresponding
to experimental point where pressure drop reduction occurs, and experimental
point where reduction does not occur, respectively [28]. Although vortex-shaped
particle paths were confirmed within the grooves when the pressure drop
reduction did not occur, this was not the case (vortex-shaped particle
paths were not confirmed) when the pressure drop reduction occurred. It
is considered that the liquid vortex (recirculation) occurrence within
the grooves was accompanied by the captured solid particles, causing the
loss of kinetic energy with respect to both the liquid and the solid particles,
and resulting in increased pressure drop.
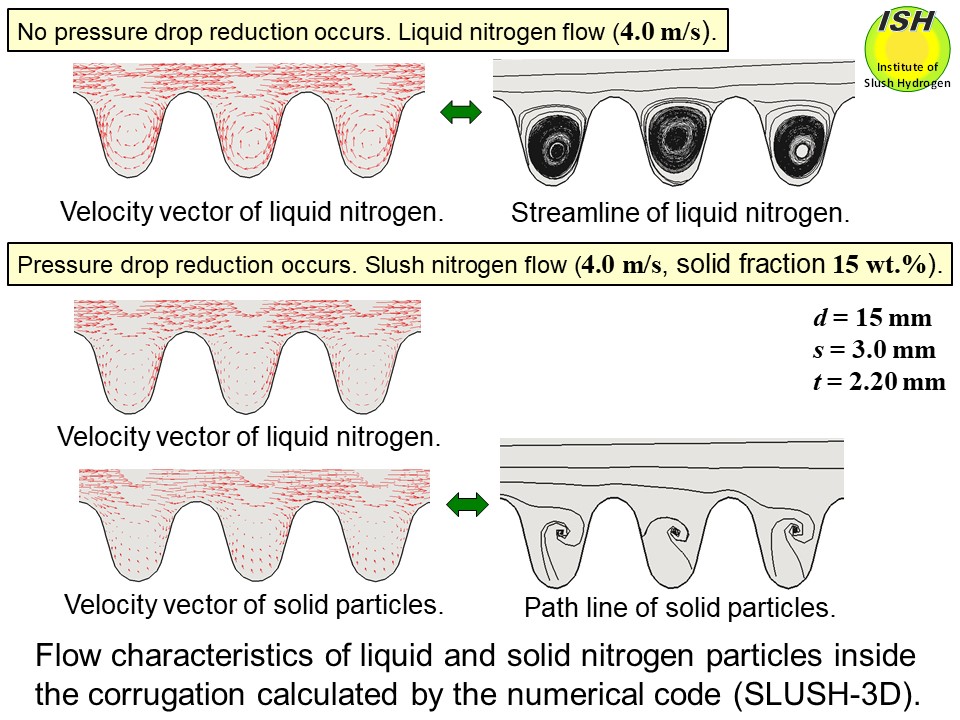
With the increased flow velocity described in the smooth circular pipe
"Circular pipe flow and PIV", the solid particles tended to move
towards the pipe center region. As a result, a liquid layer with few solid particles was formed in the vicinity of the
corrugation, serving to reduce the interference between the corrugation
and the solid particles. Furthermore, as shown in the figure below calculated by the numerical code SLUSH-3D [35], it is considered that
the group of solid particles flowing at the pipe center region served to
limit the development of turbulence or vortices in the liquid within the
corrugation, as well as limiting turbulence diffusion towards the pipe
center, thus reducing the loss of kinetic energy from the liquid and the
solid particles.
* PIV method: The velocity of solid particles is directly measured using
the Particle Image Velocimetry method.