Pressure drop reduction in converging-diverging pipe, and flow behavior of solid nitrogen particles

Sindt et al. measured pressure drop during the slush hydrogen flow through
a cryogenic valve [32]. Pressure drop comparison was undertaken between
slush hydrogen and liquid hydrogen having the same amount of volumetric
flow through the partially opened valve, and reduced pressure drop was
reported for the slush hydrogen. Also, during the slush hydrogen flow through
the partially opened valve, unlike the case of a straight pipe, the amount
of pressure drop reduction was found to rise with increased solid fraction,
reaching a maximum of 23% at a solid fraction of 35-45 wt.%. While a partially
opened valve can be considered structurally as a type of converging-diverging
(C-D) pipe, neither the flow structure nor the reduction mechanism of slush
hydrogen during pressure drop reduction in partially opened valve was reported.
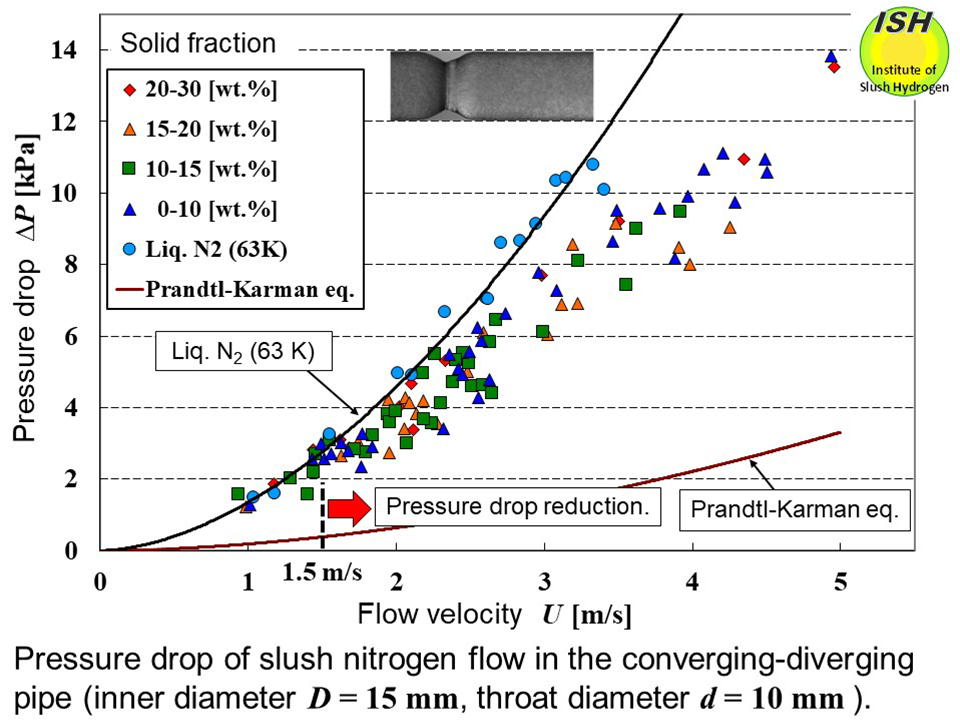
Experimental results are shown in the above figure for flow velocity and pressure drop in the C-D pipe [28]. The solid line
indicates the least squares approximation curve for liquid nitrogen while
the solid line above 3.4 m/s presents the extrapolated approximation curve.
the C-D pipe has an inner diameter D = 15 mm, a throat diameter d = 10 mm and a short constriction with a throat length of approximately
12 mm. Pressure drop was measured over a total length of C-D and smooth
circular pipes of 295 mm. Pressure drop for a smooth circular pipe using
the Prandtl-Karman eq. is also shown.
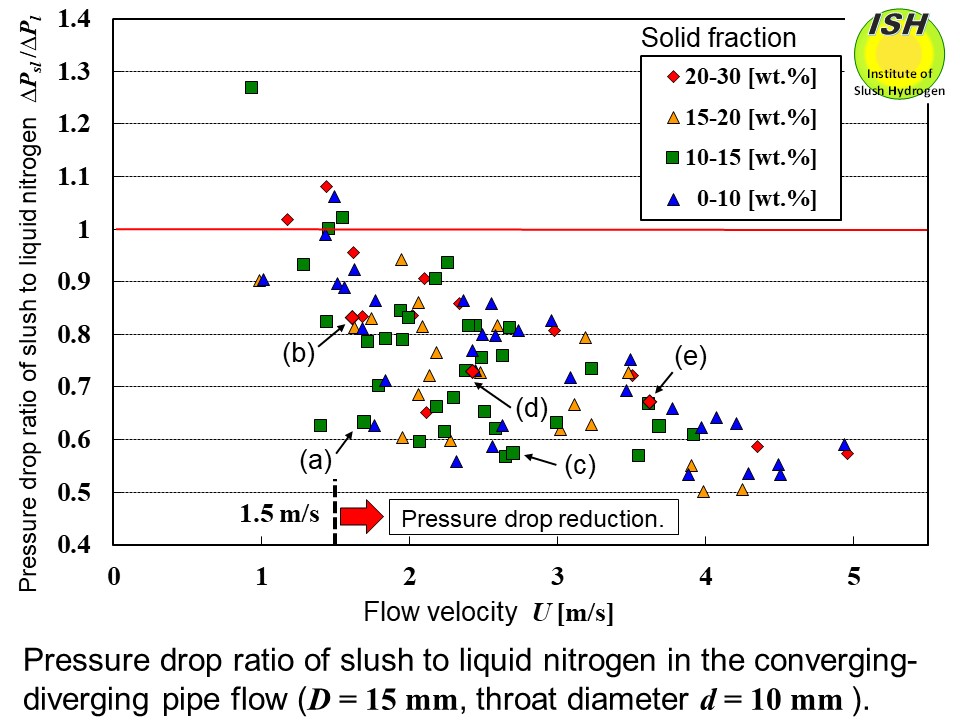
The figure below illustrates the relationship between the flow velocity and the pressure
drop ratio r of slush nitrogen pressure drop to liquid nitrogen pressure drop [28].
Here, the liquid nitrogen pressure drop obtained from the least squares
approximation curve (including the extrapolation curve) for liquid nitrogen
at the same flow velocity is used. At a flow velocity of approximately 1.5 m/s, the pressure drop reduction
starts to become obviously apparent, with the amount of reduction increasing
with increased flow velocity, reaching a maximum reduction of 50% in comparison
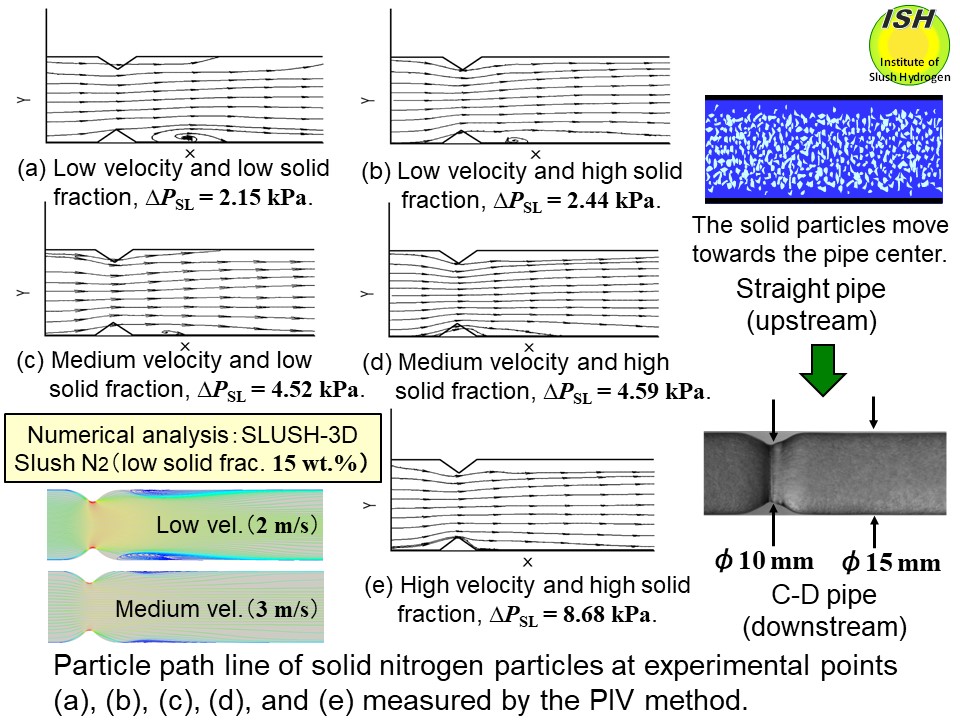
with liquid nitrogen. The PIV method was employed to measure the velocity distribution of solid
particles at the experimental points (a), (b), (c), (d), and (e) in the
figure below.
Looking at the difference in pressure drop ratio r attributable to the solid fraction at the same flow velocity, the pressure
drop ratio is generally higher (i.e., the amount of reduction becomes less)
in the case of a high solid fraction (20-30 wt.%) as compared to a medium
solid fraction (10-20 wt.%).
At a high solid fraction, interference becomes greater between the liquid
and the solid particles, among the solid particles themselves, and between
the solid particles and the pipe wall, and the reduction effect is thought
to become less due to the loss of kinetic energy.
In the case of a low solid fraction (0-10 wt.%), the pressure drop ratio
becomes generally higher, with experimental values often about the same
as for a high solid fraction, and it is considered that the reduction effect
becomes small when the solid fraction is extremely low. At a medium solid
fraction, the pressure drop ratio becomes generally low.
Let us further consider the foregoing discussion based on the visual
observation results [28]. The figure below shows the pressure drop ΔPSL for slush nitrogen and the particle path line for solid particles passing
through the throat section, measured by the PIV method* at perpendicular
cross-sections relative to the center of the pipe; (a) low flow velocity
and a low solid fraction, (b) low flow velocity and a high solid fraction,
(c) medium flow velocity and a low solid fraction, (d) medium flow velocity
and a high solid fraction, and (e) high flow velocity and a high solid
fraction. These correspond to the experimental points in the figure below.
In a comparison of the pressure drop ratio r at the same flow velocity, as can be seen from both the low and medium
flow velocity pairs ((a) (b) and (c) (d), respectively), the pressure drop
ratio is lower (i.e., reduction amount is greater) in the case of the lower
solid fraction than for the higher solid fraction. As previously noted,
the cause of this is considered to be less interference between the liquid
and the solid particles, among the solid particles themselves, and between
the solid particles and the pipe wall.
In a comparison of the pressure drop ratio r at the same solid fraction, as can be seen from the low and high solid
fraction pairs ((a) (c) and (b) (d) (e), respectively), the pressure drop
ratio is lower (reduction amount is greater) at a higher flow velocity
than at a lower flow velocity. Also, a vortex (recirculation) due to liquid
separation occurs at the bottom of the downstream region immediately after
the throat section, and as can be seen from (a) (b) (c), the size of this
vortex (visualized as solid particles are caught up in the liquid immediately
downstream from the throat section) becomes smaller at a higher flow velocity
and a higher solid fraction (refer to the numerical analysis result by
SLUSH-3D [36] in the figure). Accordingly, the size of the vortex caused
by liquid separation is also thought to become smaller. As indicated by
(d) (e), the vortex visualized by solid particles was not observed at medium
or high flow velocity in the case of a high solid fraction. Also, with
respect to the pairs indicating the same flow velocity ((a) (b) and (c)
(d)), the increase in pressure drop ΔPSL was found to be small despite the increase in solid fraction. Thus, it
is considered that the solid particles work to control the liquid flow, with the particles
reducing the increase in pressure drop caused by the increased solid fraction.
In a smooth circular pipe, due to the movement of solid particles of slush
nitrogen towards the pipe center, a liquid layer containing few solid particles
is formed in the vicinity of the pipe wall, and that the group of particles
at the pipe center region serves to limit both turbulence development at
the pipe wall and turbulence diffusion to the pipe center region (refer
to "Circular pipe flow and PIV").
In C-D pipe, it is considered that the group of solid particles that moved
towards the pipe center in the upstream serves to limit liquid separation
in the throat section. Furthermore, given that the associated inertial
force is larger than for liquid, the group of solid particles flowing at
the pipe center region does not collide with the pipe wall in the throat
section, and thus passes through without being caught up in the vortex
occurring in the throat. The solid particle group passing through the throat section with little
loss of kinetic energy then undergoes momentum exchange with the liquid
in the downstream region of the throat. As a result, it is considered that
increased pressure recovery by the downstream liquid contributes the pressure
drop reduction. In the ordinary case of a solid-liquid two-phase flow in a straight pipe,
pressure drop occurs due to the momentum transfer from the liquid to the
solid particles, but in the present case of C-D pipe, the reverse momentum
transfer occurs.
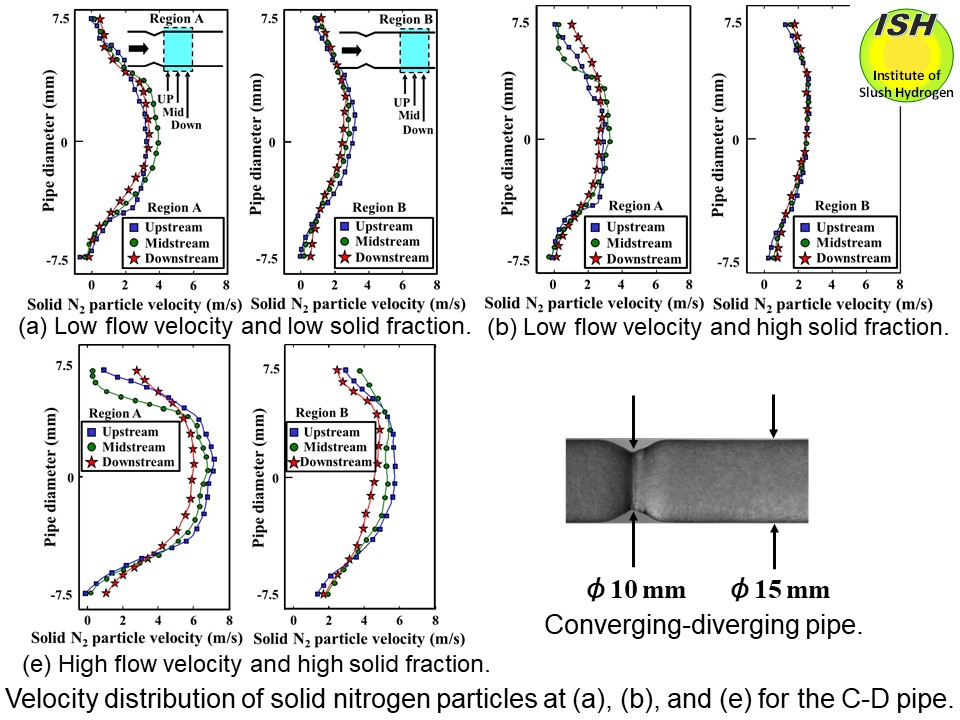
In order to confirm this momentum exchange between the solid particles
and the liquid, the velocity distribution of the solid particles obtained from the PIV
results at the points (a), (b), and (e) is shown in the figure below [28]. Taking the pipe downstream portion immediately after the throat
section as Region A (section length of 0-14 mm), and the subsequent pipe
downstream portion as Region B (14-28 mm), the upstream, midstream, and
downstream flow velocity distributions are respectively shown.
In Region A at the point (a), the flow velocity at the pipe center is
greater with respect to the midstream than for the upstream or downstream,
because the flow area in the midstream region is narrower due to the vortex
formed by the liquid as indicated in the figure of particle path line (a).
In Region B, as the flow progresses from upstream to midstream, and then
to downstream, the velocity distribution becomes flatter, with the flow
velocity becoming smaller and momentum exchange with the liquid being observed.
In Region A at the point (b), the midstream flow velocity at the pipe
center is slightly greater than for the upstream or downstream, due to
the presence of the vortex indicated in the figure of particle path line
(b). The downstream velocity distribution is somewhat flat. In Region B,
the upstream, midstream, and downstream velocity distributions are all
similar. It is considered that, since the flow velocity is small and the
solid fraction is large, momentum exchange between the solid particles
and the liquid is promoted over time (given that the flow velocity is low)
from the downstream portion of Region A, while momentum exchange has nearly
finished in Region B.
In Region A at the point (e), flow velocity at the pipe center is greatest
with respect to the upstream, with the distributions becoming flatter in
the order of upstream, midstream, and downstream. The reasons for the upstream
flow velocity being the highest are considered to be that the liquid separation
region is small, and that the solid particles with large inertial force
pass through the separation region without undergoing interference with
the liquid. In Region B, as the flow progresses from upstream to midstream,
and then to downstream, the velocity distributions also become flatter,
with lower mean flow velocity becoming clearly apparent, and momentum exchange
between the solid particles and the liquid being observed. Accordingly,
as noted previously, increased pressure recovery by the liquid from momentum
exchange is considered to contribute the pressure drop reduction.
The reason for the greater amount of slush nitrogen pressure drop reduction
(40-50%) in our study as compared to the amount reported by Sindt et al.
[32] for slush hydrogen (23%) is thought to be the fact that the structure
of the C-D pipe is simpler than that of a valve, thus tending to more easily
facilitate momentum exchange between the solid particles and the liquid.
* PIV method: The velocity of solid particles is directly measured using
the Particle Image Velocimetry method.


